
After reprinting the Whig and Republican songbooks from 1844 and 1888 I thought I’d be done with this. But hey, it’s time to stand up for truth.
Who knew that Teen Vogue would be a bastion of hard-hitting journalism?
The CIA officially determined that Russia intervened in our election, and President-elect Donald Trump dismissed the story as if it were a piece of fake news. “These are the same people that said Saddam Hussein had weapons of mass destruction,” his transition team wrote in a statement. “The election ended a long time ago in one of the biggest Electoral College victories in history. It’s now time to move on and ‘Make America Great Again’.”
Of the statements in that release, we have three supposed facts and one opinion.
“These are the same people that said Saddam Hussein had weapons of mass destruction,”
Not true: the intelligence community didn’t say that Saddam had weapons of mass destruction. Bush, Cheney, and Rumsfeld did, and they were lying as they spoke. I may get more into this later, to provide the proofs.
“The election ended a long time ago…”
Not true. One month and four days isn’t a “long time.” And, until the Electoral College (designed to be our last bastion against demagogues) votes, the election still isn’t over.
“…in one of the biggest Electoral College victories in history.”
Not true. Fully two-thirds of Electoral College victories, 1804-present, have been bigger.
Let’s fact-check that. The presumed result in the Electoral College this time around (if the Electoral College doesn’t do their job) is Trump:Clinton 306:232. How does that stack up as one of the biggest Electoral College victories in history?
Looking at recent history, 1960-2016 inclusive, there were fifteen elections. Trump comes in 10 out of 15. He came in ahead of Kennedy in 1960, Nixon in 1968, Carter in 1976, Bush in 2004, and Bush in 2000.
Source: http://www.270towin.com/historical-presidential-elections/
| Year | Winner | Loser | Third Party | Candidates | Winner’s Per Cent of the Electoral College |
|---|---|---|---|---|---|
| 2016 | 306 | 232 | 0 | Trump/ Clinton | 59.8% (presumed) |
| 2012 | 332 | 206 | 0 | Obama/ Romney | 61.7% |
| 2008 | 365 | 173 | 0 | Obama/ McCain | 67.8% |
| 2004 | 286 | 251 | 0 | Bush/ Kerry | 53.3% |
| 2000 | 271 | 266 | 0 | Bush/ Gore | 50.5% |
| 1996 | 379 | 159 | 0 | Clinton/ Dole | 70.4% |
| 1992 | 370 | 168 | 0 | Clinton/ Bush | 68.8% |
| 1988 | 426 | 111 | 0 | Bush/ Dukakis | 79.3% |
| 1984 | 525 | 13 | 0 | Reagan/ Mondale | 97.6% |
| 1980 | 489 | 49 | 0 | Reagan/ Carter | 90.9% |
| 1976 | 297 | 270 | 0 | Carter/ Ford | 52.4% |
| 1972 | 520 | 17 | 0 | Nixon/ McGovern | 96.8% |
| 1968 | 301 | 191 | 46 | Nixon/ Humphrey/ Wallace | 55.9% |
| 1964 | 486 | 52 | 0 | Johnson/ Goldwater | 90.3% |
| 1960 | 303 | 219 | 15 | Kennedy/ Nixon/ Byrd | 56.4% |
Alaska and Hawaii became states in 1959 and the size of the Electoral College changed then. But if we look at the record from the century since 1912 (when New Mexico and Arizona joined the Union), we find Trump faring even worse. Whether you look at raw numbers of electoral votes or percent of the Electoral College, he comes in 20th out of 27. To the five that he beat between 1960 and 2016, Trump only comes in ahead of Truman in 1948 and Wilson in 1916.
Alaska and Hawaii admitted to the Union (1959)
| 1956 | 457 | 73 | 0 | Eisenhower/ Stevenson | 86.2% |
| 1952 | 442 | 89 | 0 | Eisenhower/ Stevenson | 83.2% |
| 1948 | 303 | 189 | 39 | Truman/ Dewey/ Thurmond | 57.1% |
| 1944 | 432 | 99 | 0 | Roosevelt/ Dewey | 81.4% |
| 1940 | 449 | 82 | 0 | Roosevelt/ Wilkie | 84.6% |
| 1936 | 532 | 8 | 0 | Roosevelt/ Landon | 98.5% |
| 1932 | 472 | 59 | 0 | Roosevelt/ Hoover | 88.9% |
| 1928 | 444 | 87 | 0 | Hoover/ Smith | 83.6% |
| 1924 | 382 | 116 | 13 | Coolidge/ Davis/ LaFollette | 74.8% |
| 1920 | 404 | 127 | 0 | Harding/ Cox | 76.1% |
| 1916 | 277 | 254 | 0 | Wilson/ Hughes | 52.2% |
| 1912 | 425 | 88 | 8 | Wilson/ Roosevelt/ Taft | 81.6% |
Arizona and New Mexico admitted to the Union (1912)
20th out of 27. Our boy Trump is firmly ensconced in the bottom third over the last century.
Between 1804 and 1908 we have another twenty-seven elections. I’m switching over to the winner’s percentage of the Electoral College here, because the size of the EC kept changing as territories became states and states changed in population. How’s Trump compare?
Woo! looking only at those 104 years he’s eleventh out of twenty-seven. He’s rocked his way up to having only 60% of the Electoral College victories being greater than his.
When we look at the elections between 1804 and 1908 Trump with his 59.8% only came in ahead of:
| Year | Candidates | Winner’s per cent in the EC |
|---|---|---|
| 1888 | Harrison/ Cleveland | 59.6% |
| 1860 | Lincoln/ Breckinridge/ Bell/ Douglas | 59.4% |
| 1812 | Madison/ George Clinton | 59.0% |
| 1856 | Buchanan/ Fremont/ Fillmore | 58.8% |
| 1880 | Garfield/ Hancock | 58.0% |
| 1836 | Van Buren/ Harrison/ White/ Webster/ Mangum | 57.8% |
| 1848 | Taylor/ Cass | 56.2% |
| 1884 | Cleveland/ Blaine | 54.6% |
| 1876 | Hayes/ Tilden | 50.1% |
| 1824 | Jackson/ Adams/ Crawford/ Clay | 37.9% |
(Note: The 1824 election had no winner in the Electoral College and went to the House under the 12th Amendment where Adams prevailed.)
From 1789 to 1800 inclusive, the electoral process was entirely different. The candidate winning the most votes in the Electoral College became president, while the person with the second-most votes became vice-president. Washington is considered to have been elected unanimously for both of his terms (1789 and 1792). 1796, the first contested election, gave us a president and vice-president from different parties (Adams, a Federalist, and Jefferson, a Democratic-Republican). The election of 1800, which left Jefferson and Burr tied in the Electoral College (Jefferson became President, Burr his Vice-President) showed that the system was unworkable, leading to the modern ticket/running-mate system. Those four eighteenth century elections can’t be compared in any meaningful way with elections in the 19th, 20th, or 21st centuries.
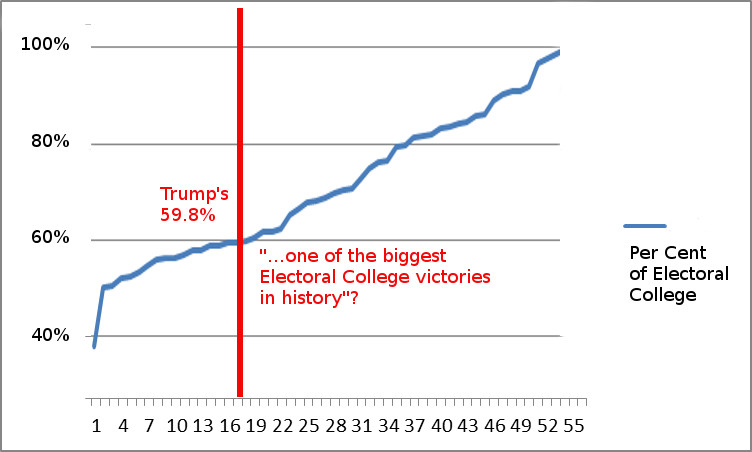
CONCLUSION: When the Republicans call Mr. Trump’s victory “one of the biggest Electoral College victories in history” they are lying.
Why lie about something so trivial, and so easily checked?
| Election year | Winner | Loser | Third Party | Candidates | Per Cent |
|---|
| 1820 | 231 | 1 | 0 | Monroe/ Adams | 99.6 |
| 1936 | 532 | 8 | 0 | Roosevelt/ Landon | 98.5 |
| 1984 | 525 | 13 | 0 | Reagan/ Mondale | 97.6 |
| 1972 | 520 | 17 | 0 | Nixon/ McGovern | 96.8 |
| 1804 | 162 | 14 | 0 | Jefferson/ Pinckney | 92.0 |
| 1864 | 212 | 21 | 0 | Lincoln/ McClellan | 91.0 |
| 1980 | 489 | 49 | 0 | Reagan/ Carter | 90.9 |
| 1964 | 486 | 52 | 0 | Johnson/ Goldwater | 90.3 |
| 1932 | 472 | 59 | 0 | Roosevelt/ Hoover | 88.9 |
| 1956 | 457 | 73 | 0 | Eisenhower/ Stevenson | 86.2 |
| 1852 | 254 | 42 | 0 | Pierce/ Scott | 85.8 |
| 1940 | 449 | 82 | 0 | Roosevelt/ Wilkie | 84.6 |
| 1816 | 183 | 34 | 0 | Monroe/ King | 84.3 |
| 1928 | 444 | 87 | 0 | Hoover/ Smith | 83.6 |
| 1952 | 442 | 89 | 0 | Eisenhower/ Stevenson | 83.2 |
| 1872 | 286 | 42 | 21 | Grant/ Hendricks/ Brown/ Jenkins/ Davis | 81.9 |
| 1912 | 425 | 88 | 8 | Wilson/ Roosevelt/ Taft | 81.6 |
| 1944 | 432 | 99 | 0 | Roosevelt/ Dewey | 81.4 |
| 1840 | 234 | 60 | 0 | Harrison/ Van Buren | 79.6 |
| 1988 | 426 | 111 | 0 | Bush/ Dukakis | 79.3 |
| 1832 | 219 | 49 | 18 | Jackson/ Clay/ Floyd/ Wirt | 76.6 |
| 1920 | 404 | 127 | 0 | Harding/ Cox | 76.1 |
| 1924 | 382 | 116 | 13 | Coolidge/ Davis/ LaFollette | 74.8 |
| 1868 | 214 | 80 | 0 | Grant/ Seymour | 72.8 |
| 1904 | 336 | 140 | 0 | Roosevelt/ Parker | 70.6 |
| 1996 | 379 | 159 | 0 | Clinton/ Dole | 70.4 |
| 1808 | 122 | 47 | 6 | Madison/ Pinckney/ Clinton | 69.7 |
| 1992 | 370 | 168 | 0 | Clinton/ Bush | 68.8 |
| 1828 | 178 | 83 | 0 | Jackson/ Adams | 68.2 |
| 2008 | 365 | 173 | 0 | Obama/ McCain | 67.8 |
| 1908 | 321 | 162 | 0 | Taft/ Bryan | 66.5 |
| 1900 | 292 | 155 | 0 | McKinley/ Bryan | 65.3 |
| 1892 | 277 | 145 | 22 | Cleveland/ Harrison/ Weaver | 62.4 |
| 1844 | 170 | 105 | 0 | Polk/ Clay | 61.8 |
| 2012 | 332 | 206 | 0 | Obama/ Romney | 61.7 |
| 1896 | 271 | 176 | 0 | McKinley/ Bryan | 60.6 |
| 2016 | 306 | 206 | 0 | Trump/ Clinton | 59.8 |
| 1888 | 233 | 158 | 0 | Harrison/ Cleveland | 59.6 |
| 1860 | 180 | 72 | 51 | Lincoln/ Breckinridge/ Bell/ Douglas | 59.4 |
| 1812 | 128 | 89 | 0 | Madison/ Clinton | 59.0 |
| 1856 | 174 | 114 | 8 | Buchanan/ Fremont/ Fillmore | 58.8 |
| 1880 | 214 | 155 | 0 | Garfield/ Hancock | 58.0 |
| 1836 | 170 | 73 | 51 | Van Buren/ Harrison/ White/ Webster/ Mangum | 57.8 |
| 1948 | 303 | 189 | 39 | Truman/ Dewey/ Thurmond | 57.1 |
| 1960 | 303 | 219 | 15 | Kennedy/ Nixon/ Byrd | 56.4 |
| 1848 | 163 | 127 | 0 | Taylor/Cass | 56.2 |
| 1968 | 301 | 191 | 46 | Nixon/ Humphrey/ Wallace | 55.9 |
| 1884 | 219 | 182 | 0 | Cleveland/ Blaine | 54.6 |
| 2004 | 286 | 251 | 0 | Bush/ Kerry | 53.3 |
| 1976 | 297 | 270 | 0 | Carter/ Ford | 52.4 |
| 1916 | 277 | 254 | 0 | Wilson/ Hughes | 52.2 |
| 2000 | 271 | 266 | 0 | Bush/ Gore | 50.5 |
| 1876 | 185 | 184 | 0 | Hayes/ Tilden | 50.1 |
| 1824 | 99 | 84 | 78 | Jackson/ Adams/ Crawford/ Clay | 37.9 |

Who knew that Teen Vogue would be a bastion of hard-hitting journalism?
Say that Teen Vogue‘s readers are mainly young women between 13 and 21. Most of them are going to be of voting age by the next presidential election, and some of them are going to be of voting age even earlier, by the time the mid-terms roll around. And a whole lot of them aren’t very happy right now.